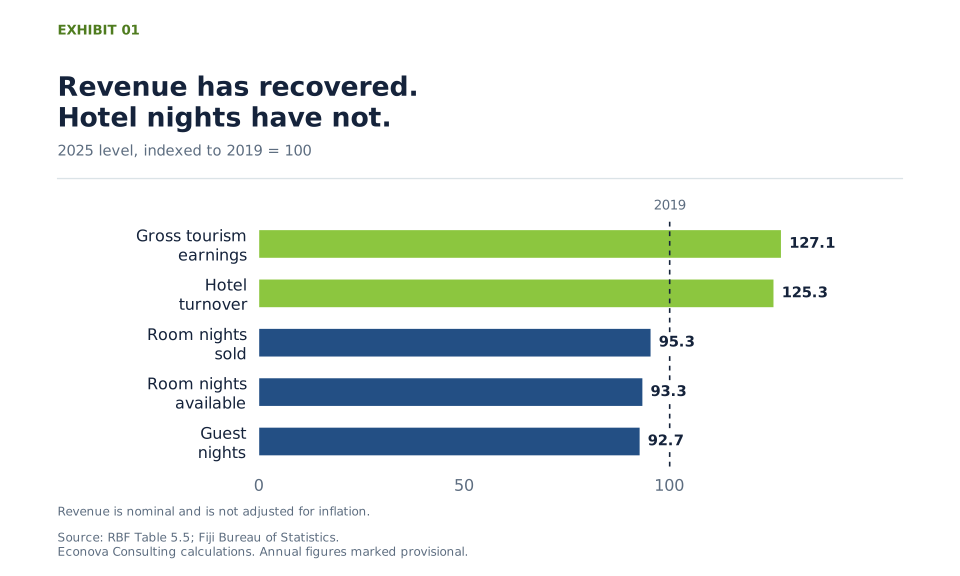
Fiji’s hotel sector generated F$1.63 billion in turnover in 2025, according to the reported annual figures in the Reserve Bank of Fiji’s hotel statistics workbook. That was 25.3% above 2019. Yet hotels sold 2.10 million room nights, 4.7% fewer than in 2019. A stronger revenue total therefore tells only part of the recovery story.
The distinction matters for operators, tourism planners and infrastructure providers. Rising turnover can support the sector, but it does not establish that visitor volumes, real output or profitability have recovered at the same pace. All revenue comparisons here are in current Fiji dollars. The workbook provides no adjustment for inflation or information on operating costs.
Revenue and physical activity tell different stories
Gross tourism earnings reached F$2.81 billion in 2025, 27.1% above 2019. Hotel turnover followed a similar direction. Physical activity was weaker: total guest nights were 7.3% below 2019 and available room nights were 6.7% lower.
Room occupancy nevertheless increased from 55.8% to 57.0%. That is possible because the reported supply of available room nights fell more than sales did. Higher occupancy alone should therefore not be read as evidence of a larger accommodation market. Available room nights are a measure of reported capacity over a period, rather than a count of hotel buildings or evidence of permanent closures.

In 2025, revenue grew faster than room sales
The same divergence appears in the comparison with 2024. Hotel turnover rose 6.3%, while room nights sold increased by 1.3% and total guest nights by 0.9%. Reported occupancy improved by just 0.18 percentage points.
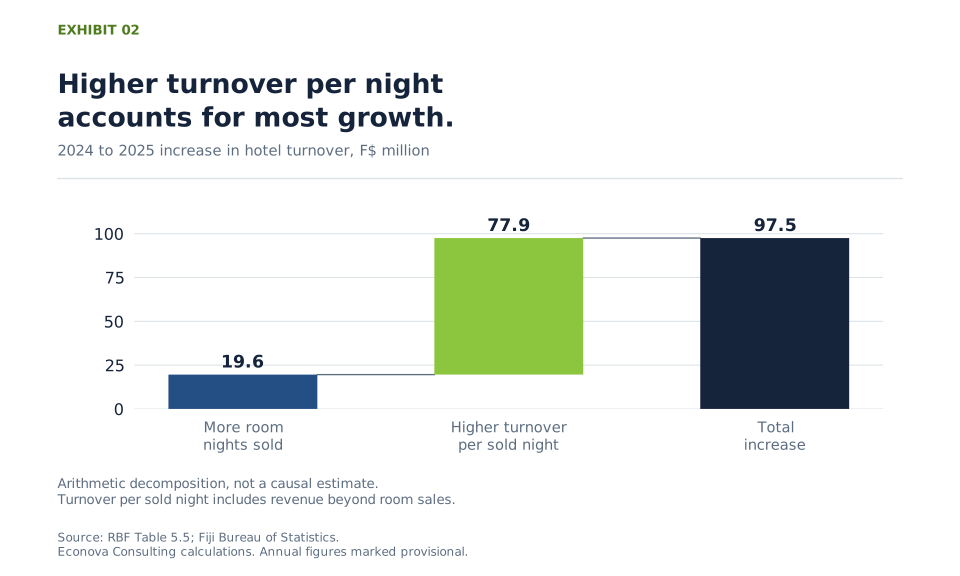
Dividing total hotel turnover by room nights sold gives F$777 per sold night in 2025, up from F$740 in 2024. This is a broad revenue intensity measure. It includes turnover beyond room sales and is not an average room rate. Changes in accommodation prices, food and beverage sales, other services, the mix of properties and the composition of guests could all affect it. The workbook does not separate those influences.
A simple accounting decomposition makes the scale clear. Holding turnover per sold night at its 2024 level, additional room sales account for F$19.6 million of the F$97.5 million turnover increase. The remaining F$77.9 million, about 80%, is associated with higher turnover per sold night. This is an arithmetic allocation, not proof of what caused the increase.

Seasonal demand deserves as much attention as capacity
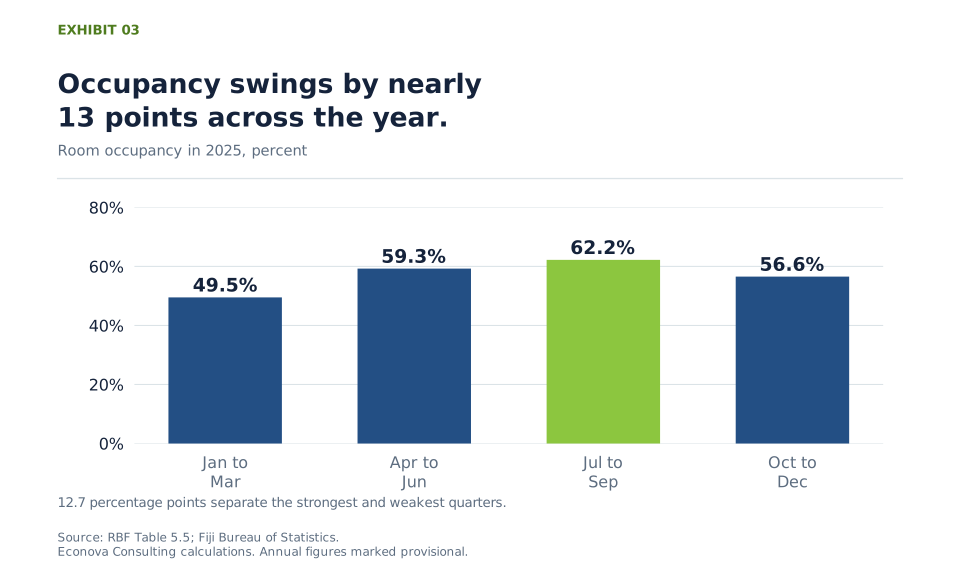
Annual occupancy masks a clear seasonal pattern. In 2025, occupancy was 49.5% in the March quarter and 62.2% in the September quarter, a gap of 12.7 percentage points. The June and December quarters sat between them at 59.3% and 56.6%.
For an operator, this points to the value of testing demand outside the strongest quarter: different visitor segments, events, domestic travel and offers that encourage longer stays. Each option needs a commercial case that accounts for the cost of attracting and serving an additional guest. Filling a room at an uneconomic price does not improve the business.
For planners, the national average is a starting point. It cannot establish whether a particular island, destination or hotel category needs more capacity. Local seasonality, room quality, transport access and infrastructure constraints may produce very different conditions.

March 2026 extends the revenue and volume divergence
The final quarter available in the supplied workbook is March 2026. Compared with March 2025, reported hotel turnover increased 12.7% to F$310.6 million, while room nights sold rose 0.5%. Occupancy moved from 49.5% to 49.7%. This comparison uses the same quarter in each year to limit seasonal distortion.
The March 2026 guest night entries exactly repeat December 2025. They require clarification, so this article does not use them to infer guest growth. One quarter also provides no basis for a forecast of the full year.
What the figures imply for tourism strategy
Track the quality of revenue growth
Operators should separate accommodation revenue, ancillary sales and changes in the guest mix, then compare those movements with costs and margins. Aggregate turnover cannot show whether a higher sales total is translating into stronger returns.
Build the demand case by season and location
Destination planning should examine where and when additional visitors can be accommodated. An annual national occupancy figure is too broad to determine the timing or location of new hotel, transport, water or electricity investment.
Use physical measures alongside earnings
A useful sector scorecard would track room nights sold, guest nights, available capacity and occupancy alongside revenue. Adding real expenditure and operating performance, where reliable data exist, would help distinguish price effects from growth in activity and economic value.
Sources and calculation notes
Source: Reserve Bank of Fiji, Economic and Financial Statistics, Table 5.5, Hotel Statistics, using the supplied workbook. Its Notes sheet credits the Fiji Bureau of Statistics. Analysis and charts are by Econova Consulting. This article analyses that data snapshot rather than claiming to reproduce every subsequent revision.
- Periods and units. The annual comparisons use the reported 2019, 2024 and 2025 rows, each marked “(p)” in the workbook. These figures are treated as provisional. Room and guest nights are reported in thousands; turnover and tourism earnings are in F$ million. Occupancy uses the reported percentage column. A guest night counts one guest for one night; it is different from a room night.
- Reconciliation. The reported 2025 annual totals exceed the sum of the four quarterly entries by 2,480 available room nights, 1,628 sold room nights and F$2.767 million of hotel turnover. Annual comparisons retain the annual rows; the seasonal exhibit uses quarterly occupancy. The workbook does not explain the differences. March 2026 guest nights repeat December 2025 and are excluded from the narrative analysis.
- Methods. Exhibit 1 divides each 2025 annual value by its 2019 equivalent and multiplies by 100. Exhibit 2 allocates the turnover change first to the change in sold nights at the 2024 turnover per night, then to the change in turnover per night at the 2025 volume. The second component includes the interaction between volume and revenue intensity. Exhibit 3 uses the four reported 2025 quarterly occupancy rates.
- Interpretation. Turnover per sold night divides total hotel turnover by sold room nights, with the appropriate unit conversion. It is neither an average daily room rate nor a measure of profit. Revenue is nominal. No causal attribution, inflation adjustment or forecast is made.
View the annual figures behind the analysis
| Measure | 2019 | 2024 | 2025 |
|---|---|---|---|
| Available room nights, million | 3.949 | 3.651 | 3.686 |
| Sold room nights, million | 2.204 | 2.075 | 2.102 |
| Room occupancy, percent | 55.8 | 56.8 | 57.0 |
| Total guest nights, million | 4.663 | 4.283 | 4.321 |
| Hotel turnover, F$ million | 1,303.686 | 1,535.860 | 1,633.346 |
| Gross tourism earnings, F$ million | 2,213.751 | 2,536.800 | 2,813.800 |