Consumer prices in Fiji tell a story of three distinct acts: a pandemic-driven deflation, a commodity-shock surge driven by global energy and food prices, and a measured cooling that began in late 2024. Understanding which categories drove each phase — and what the numbers say today — matters enormously for tariff design, cost-of-service modelling, and any economic assessment that touches household welfare.
The CPI is not just an inflation number — it is a map of what is getting more expensive for Fijian households, and why.
All data on this page is sourced from the Fiji Bureau of Statistics CPI Release (May 2026), 2019-base series. The charts are published as static images for this article.
Headline CPI: The Full Monthly Journey
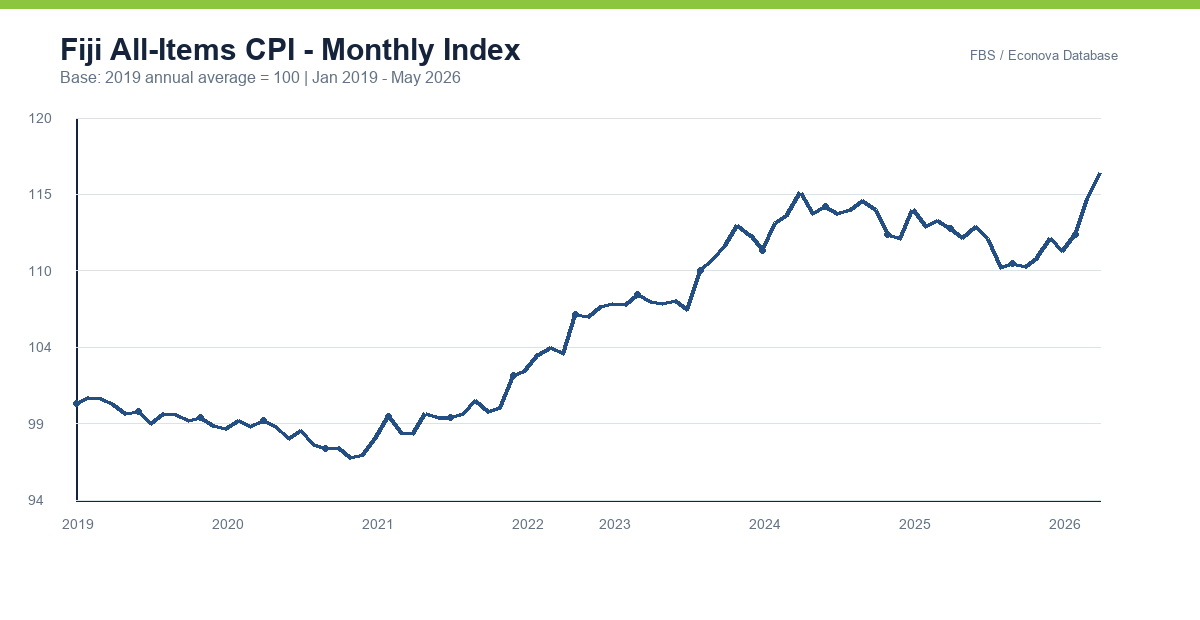
The chart below traces the all-items CPI index from January 2019 through to the latest release. The 2019 baseline (index = 100) allows direct comparison across all subsequent months. A sharp deflation dip in 2020 — driven primarily by COVID-related demand collapse and falling fuel prices — was followed by a steady post-pandemic surge, peaking around mid-2024 before the index began to moderate.
Category Deep-Dive: Not All Prices Move the Same Way
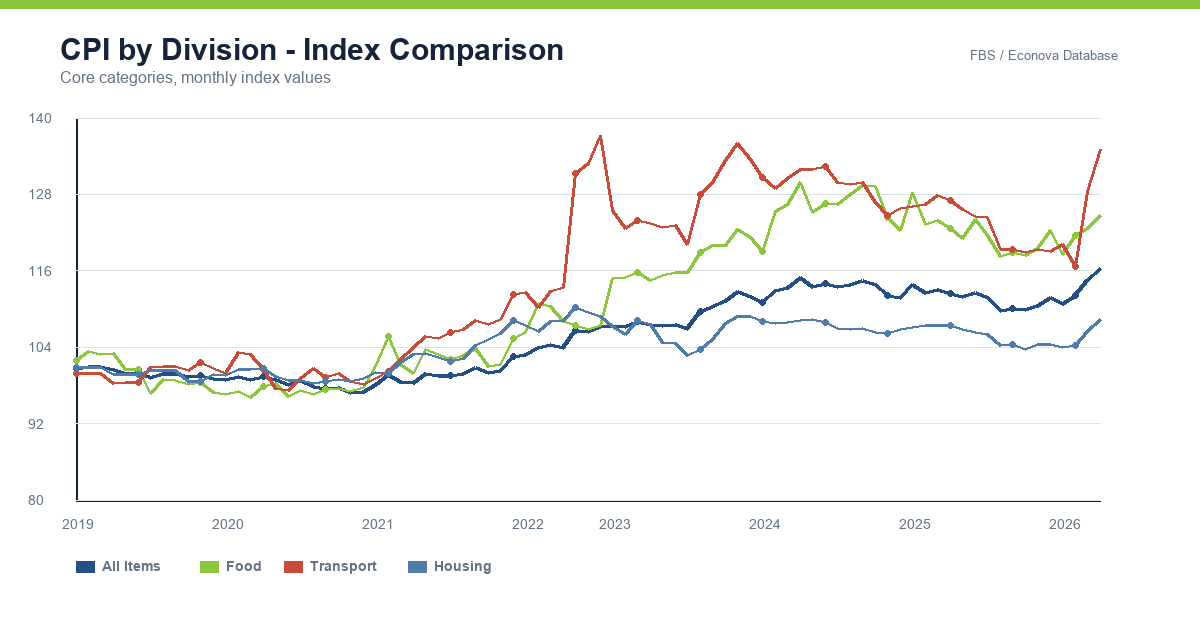
The aggregate headline number masks dramatically different trajectories across Fiji's 13 CPI divisions. Food and non-alcoholic beverages — with a basket weight of 309.3 per thousand — have been the most persistent upward driver. Transport, despite its severe 2022 spike, has since retreated. Meanwhile categories like clothing and communication have remained largely stable, suggesting well-anchored supply chains in those segments.
Annual Inflation by Category: The Heat Map
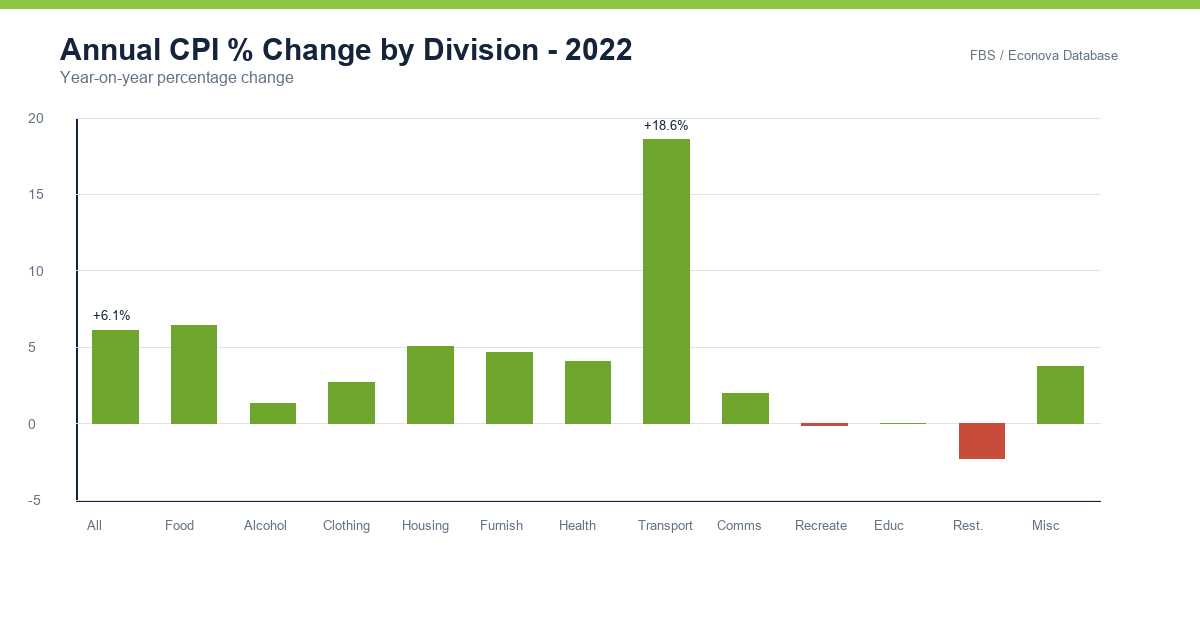
The bar chart below shows year-on-year percentage changes across all divisions, for each year since 2012. The annual category view reveals how structurally different each inflationary episode has been. The 2022 shock was broad-based, with transport at the epicentre.
The Squeeze on Fijian Households: Food & Transport
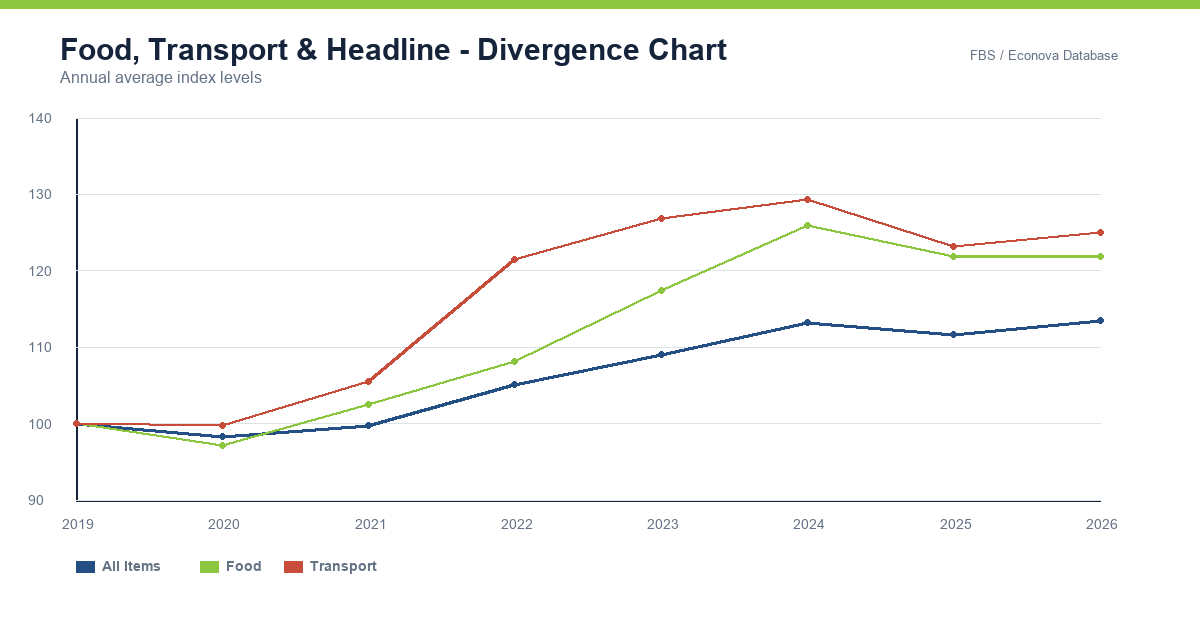
Together, food and transport account for nearly 448 out of every 1,000 units of basket weight — almost half of the average household's spending. Plotting their combined trajectory against the headline index reveals how closely household cost-of-living tracks these two volatile categories. When both are rising simultaneously — as in 2022 — the impact on lower-income households is acute and often faster than wage adjustments can compensate.
What the Numbers Say for 2026
The May 2026 CPI release shows the headline index at 116.3 — up from 110.9 in January, driven primarily by a transport surge (135.1) as global oil prices rebounded. Food (124.7) remains the most elevated major category relative to the 2019 base. Communication (101.7) and education (99.4) remain anchored near or below the base, a structural feature of regulated or government-subsidised services.
For analysts, regulators, and policy advisors working in Fiji's utilities and infrastructure space, three trends demand attention entering the second half of 2026:
- Transport re-acceleration: the April–May 2026 transport index surge (128.4 to 135.1) signals renewed fuel cost pressure, which will filter into electricity tariff and logistics costs.
- Food price stickiness: despite the 2025 annual deflation, food prices have re-accelerated in early 2026, suggesting import-side pressures have not fully resolved.
- Household affordability buffer: the 2025 deflation provided temporary relief, but May 2026 data suggests that buffer is narrowing — a consideration for any cost-pass-through regulatory decision in the second half of the year.
Back to InsightsFiji's CPI is not trending back to 100. The new normal for household prices is structurally higher — and regulatory frameworks need to be designed with that reality in mind.